- regenerate clustered random points
- use prototypes
- restart using existing points
- click and drag to add examples
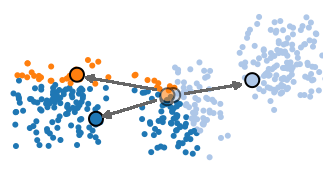
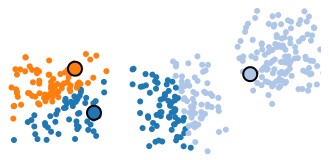
The above is a visualization of the k-means clustering algorithm in action. K-means is an unsupervised clustering algorithm, that is used to partition numerical data sets into groups of similar vectors. It’s an unsupervised algorithm, meaning that we don’t know the labels of particular clusters beforehand. More formally, k-means is an algorithm that takes n examples and partitions them into k clusters, where each example is assigned to the cluster with the nearest center. Here, I use the example of two-dimensional k-means, although it can be used with vectors in any dimension of space.
Algorithm
While it may sound complex, this algorithm is actually very simple. It consists of two steps which are iterated until the clustering is stable. Clusters are described by prototype vectors, which represent the average vector of all of the points assigned to that cluster. Think of it as the “center” of the cluster.
-
Initialization
Since the algorithm is just beginning, we’ll just randomly assign each example to one of the k clusters that we are hoping to find. This is known as random partitioning .
-
Update step
Each of the prototype vectors is updated, its position set to the average of all of the examples that are currently assigned to the cluster.
-
Assignment step
Each of the examples in the data set is assigned the label of its nearest prototype vector. If none of the examples have changed clusters, then the algorithm is finished. Otherwise, return to the update step.
Complexity and Running time
k-means has a superpolynomial worst-case running time in the number of input points. Generally, this clustering problem is NP-hard, so heuristics such as the above algorithm are used, which are not guaranteed to find the globally optimal solution.
Dicussion
Because of the assumption that all points in a cluster will be close to one another geometrically, k-means has a difficult time properly identifying non-spherical clusters of vectors. Try it out above — draw two stripes next to each other — k-means will likely split each of the stripes into multiple clusters, even though we would intuitively understand each stripe as its own cluster.
K-means has an inherent element of randomness. Depending on the random initialization of the prototype vectors, the algorithm will unfold differently. As a result, in many cases it makes sense to restart the algorithm with new initial clusterings. Then, we can look for clusterings with particularly low variances, to get a more optimal clustering.
There are plenty of limitations to K-means clustering. You may be wondering — how do I know beforehand what to set as the value of k , the number of clusters you are looking for. Well, there are few heuristics you can use. If you know the number of categories or clusters that are in the data, then you should try that.
If the number of expected clusters is unknown, it’s possible to try K-means with various numbers of prototype vectors, looking for the k that minimizes the variance of the points assigned to each cluster. Occam’s Razor comes into play here — we are looking for the simplest set of clusters that explain the examples, so we should look for small values of k that minimize variance. Obviously, if we look for very large values of k , (such as if k >> n ) then each cluster will be really small and have a low variance, but we haven’t learned much about the data set.
There are other clustering algorithms that address these problems, such as Hierarchical Agglomerative Clustering (HAC), which I will address in future visual algorithms .
var DIM=2;var LIMITS=[{min:0,max:100},{min:0,max:60}];var SCALE=5;var POINTS=1000;var CLUSTERS=10;var FRAME_DELAY=600;var points=null;var kmeans=null;var origin=null;function rerun(){reset_kmeans();CLUSTERS=parseInt(document.getElementById(“clusters”).value);kmeans=new runKmeans(points,CLUSTERS);kmeans.start()}document.getElementById(“rerun”).onclick=rerun;function reset_kmeans(){if(kmeans!=null&&kmeans.interval!=null){clearInterval(kmeans.interval);kmeans.interval=null}}function init(){POINTS=parseInt(document.getElementById(“num_points”).value);CLUSTERS=parseInt(document.getElementById(“clusters”).value);var f=document.getElementById(“point_type”).value;if(“random”==f){points=createRandomPoints(POINTS)}else{if(“clustered”==f){points=createClusteredPoints(POINTS)}}var e=document.getElementById(“container”);if(origin==null){origin=document.createElement(“svg”);origin.id=“origin”;e.appendChild(origin);origin.onmousedown=onMouseDown}else{origin.innerHTML=""}reset_kmeans();for(var h=0;h<points.length;h++){var g=document.createElement(“circle”);points[h].elem=g;g.className=“pt”;origin.appendChild(g)}refreshPosition(points);kmeans=new runKmeans(points,CLUSTERS);kmeans.start()}document.getElementById(“regenerate”).onclick=init;function onMouseDown(b){origin.onmousemove=onMouseMove;origin.onmouseup=onMouseUp;clearInterval(kmeans.interval);kmeans.interval=null}function onMouseMove(i){i.preventDefault();var g=0,h=0;if(i.target.className==""){g=i.offsetX;h=i.offsetY}else{return}var j=new Point();g=g+(Math.random()-0.5)*25;h=h+(Math.random()-0.5)*25;j[0]=g/SCALE;j[1]=h/SCALE;var e=document.createElement(“circle”);j.elem=e;e.className=“pt”;translate(j.elem,g,h);origin.insertBefore(e,origin.firstChild);points.push(j);POINTS=points.length;document.getElementById(“num_points”).value=POINTS}function onMouseUp(b){origin.onmousemove=null;origin.onmouseup=null;kmeans.start()}function runKmeans(l,o){var r=this;this.interval=null;this.start=function(){if(r.interval==null){r.assignClusters();r.interval=setInterval(function(){var a=r.tick();if(a==0){clearInterval(r.interval);r.interval=null}},FRAME_DELAY)}};this.assignClusters=function(){var f=0;for(var g=0;g<t.length;g++){t[g].points=[]}var e,c,d,b;for(var g=0;g<l.length;g++){e=l[g];b=0;c=999999999;for(var a=0;a<t.length;a++){d=dist(e,t[a]);if(d<c){c=d;b=a}}t[b].points.push(e);if(e.elem&&e.elem.className!=“c”+b){e.elem.className=“c”+b;f++}}return f};this.tick=function(){r.updateCentroids()};this.updateCentroids=function(b){for(var a=0;a<t.length;a++){var c=average(t[a].points);if(c!=null){t[a][0]=c[0];t[a][1]=c[1];if(t[a].elem){translate(t[a].elem,c[0]*SCALE,c[1]*SCALE)}}}if(b!=“undefined”){return r.assignClusters()}};for(var q=origin.childNodes.length-1;q>=0;q—){var s=origin.childNodes[q];if(s.className.substring(0,2)==“cp”){origin.removeChild(s)}}var t=createRandomPoints(o);for(var q=0;q<t.length;q++){t[q].points=[]}for(var q=0;q<l.length;q++){var m=Math.floor(Math.random()*t.length);t[m].points.push(l[q])}this.updateCentroids(true);for(var q=0;q<t.length;q++){var i=t[q];var s=document.createElement(“circle”);i.elem=s;s.className=“cp c”+q;var n=i[0]*SCALE;var p=i[1]*SCALE;translate(i.elem,n,p);origin.appendChild(s)}}function translate(e,f,g){var h=“translate(“+f+“px,“+g+“px)“;e.style.webkitTransform=h;e.style.mozTransform=h;e.style.transform=h;e.style.oTransform=h}function average(d){if(d==undefined||d.length==0){var f=null}else{var f=[0,0];for(var e=0;e<d.length;e++){f[0]+=d[e][0];f[1]+=d[e][1]}f[0]/=d.length;f[1]/=d.length}return f}function dist(c,d){return Math.sqrt(Math.pow(c[0]-d[0],2)+Math.pow(c[1]-d[1],2))}function refreshPosition(j){var i,g,h;for(var f=0;f<j.length;f++){i=j[f];g=i[0]*SCALE;h=i[1]*SCALE;translate(i.elem,g,h)}}function Point(){this.p=null}function createClusteredPoints(l){var k=[];var m=0,n=0;var o=Math.floor(l/(CLUSTERS*1));var p=15;for(var q=0;q<l;q++){if(q%o==0){m=LIMITS[0].min+(LIMITS[0].max-LIMITS[0].min)*Math.random();n=LIMITS[1].min+(LIMITS[1].max-LIMITS[1].min)*Math.random()}var i=new Point();var r=(Math.random()+Math.random())/2;i[0]=m+(r-0.5)*p;r=(Math.random()+Math.random())/2;i[1]=n+(r-0.5)*p;k.push(i)}return k}function createRandomPoints(j){var f=[];for(var g=0;g<j;g++){var h=new Point();for(var i=0;i<DIM;i++){h[i]=LIMITS[i].min+(LIMITS[i].max-LIMITS[i].min)*Math.random()}f.push(h)}return f}init();