Having moved to NYC a couple of months ago, one of the biggest changes I’ve encountered is having access to such an enormous public transportation system. The New York City Subway has a bewildering 468 stations on 24 seperate lines, with 5.2 million riders per day, and a rodent population whose number is probably similar.
As do most New Yorkers, I spend quite a bit of time staring at the subway map when riding the train. Because of the number of stations, I’ve hardly memorized anything, and still don’t fully know how to get from A to B when A isn’t my house and B isn’t my office. But it has been fun to think of other representations of the map. Thankfully, the NYC Data Mine does provide some subway data, so I got to push some pixels around with this idea…
geographic
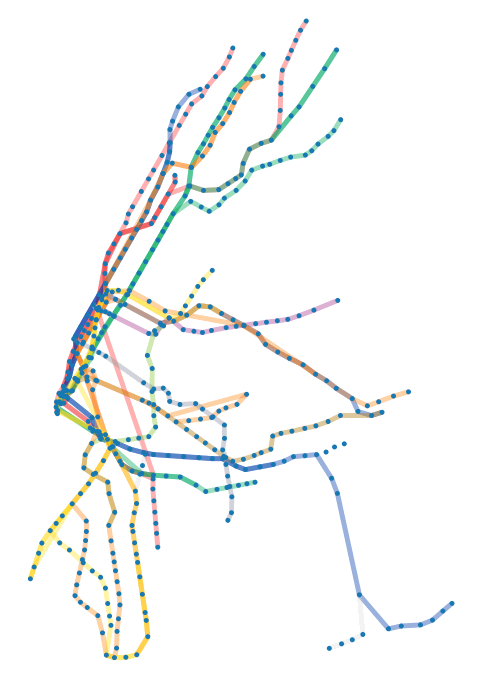
Geographic layouts were abandoned early in the 20th century, because only wizards could decipher the meaning of the tangle that resulted from having many stations in the center of a network, and few, spread further in between, at the periphery. Since station construction follows demand, this map does well to show the highest density areas in the city, and even without the map background, it’s possible to make out the shape of Manhattan. Identifying individual stations there is a challenge, however.
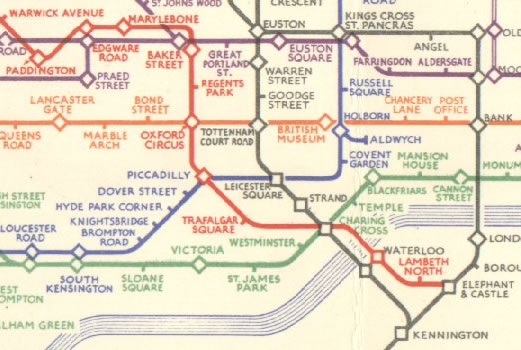
The solution to this problem, of course, was the diagramatic subway map. These were first made in London by a man named Harry Beck, who introduced them to the public in 1933. Notably, Beck chose to omit any geographical references besides the river Thames, which proved confusing to riders. Modern subway maps, like the current MTA map, integrate more geographic cues together with a diagramatic layout to help translate subterreanean stations into real places.
topological
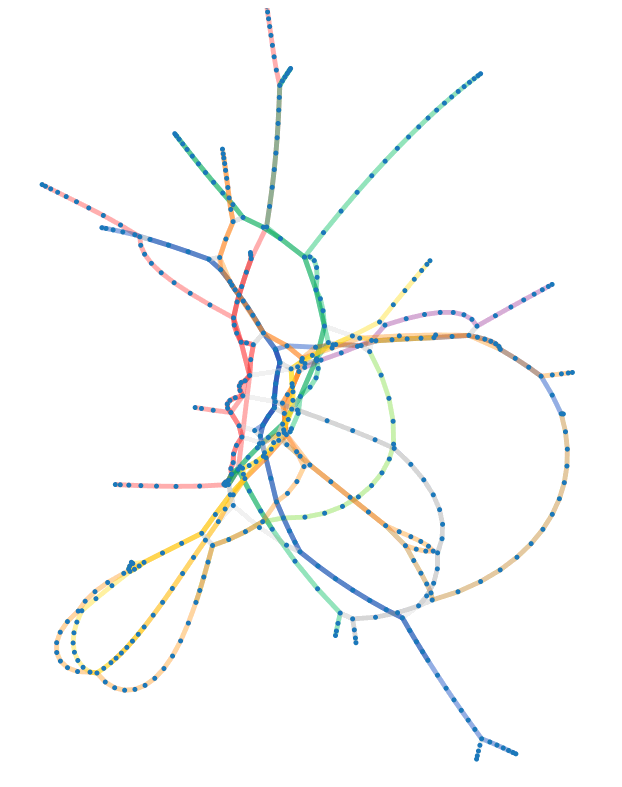
Treating each station as a negatively-charged particle, and allowing them to repel one another tied together only by station connections, the map looks strikingly different and loses all pretensions of practicality. It’s still possible to ddraw some interesting observations here that aren’t as obvious in the traditional maps. The large bulge on the right calls attention to the connection between the J, Z, and E train way out in Queens that is easy to miss otherwise. The many subway lines radiating far from the center with few side connections, like the A or 6 trains, are also shown to be quite disconnected and impractical for point-to-point travel — the only way these lines go is in to the center.
area-based
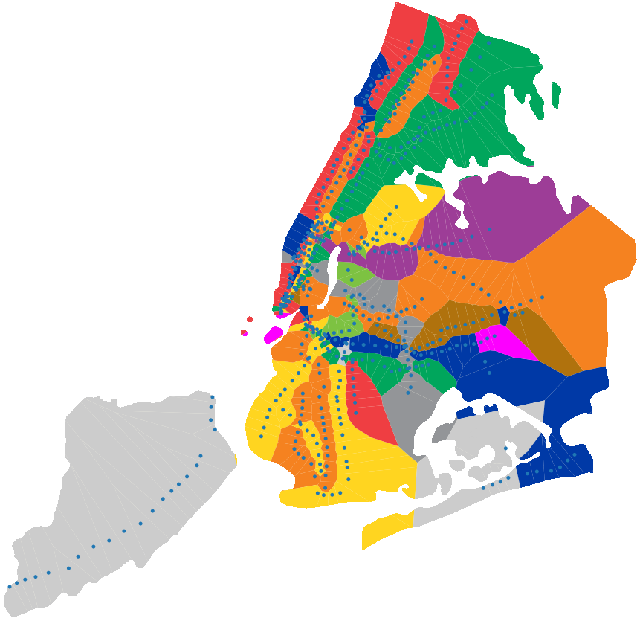
It’s also illustrative to focus on the areas around the stations rather than on the stations themselves. Above is a Voronoi diagram of the MTA network, where each piece of land is colored by the color of the closest subway line. It’s not perfect (tracks where multiple trains run are just one of the colors) but it does show how close people live to their nearest subway. The huge swaths of Queens that are bathed in purple and orange show regions that are singly served by the 7 and F trains, respectively. For many people living here, bus transport is the only effective public transportation method, since the area is so underserved by the subway.
In the end, I’m glad the map is the way it is. By learning some simple rules and a little bit of practice, it’s easy to learn how to get anywhere in the city. But it’s always fun to think of different ways to represent the same data.
The images here were made with the D3 visualization library